

Work

Synthetic data

KPI dashboard that checks your data first

Your numbers checked first, then charted.

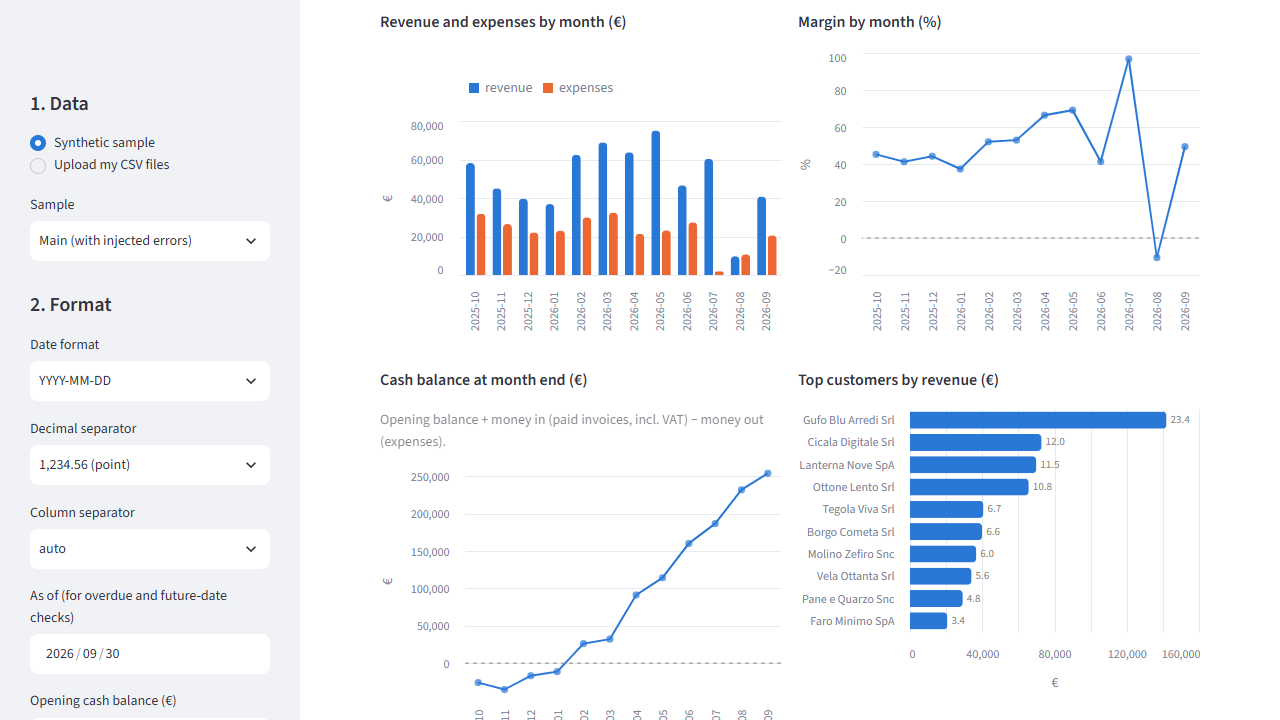
Synthetic sales and expense files are loaded; the data-checks tab lists each problem with its line and reason; the KPI tab shows revenue, margin, cash and overdue invoices from the rows that passed.

Who it is for

  • Owners of micro and small firms without a controller.
  • Anyone who prepares a monthly figures summary from CSV exports.

The challenge

A dashboard is only as good as the export behind it. Sales and expense files from accounting software carry empty cells, impossible dates, repeated invoice numbers and VAT that does not add up. A dashboard that charts them anyway hides the problem until a total looks wrong.

What we built

  1. Reads two CSV exports, sales (invoices) and expenses: comma or semicolon separated, Italian (31/03/2026), ISO or US dates, 1.234,56 or 1,234.56 amounts. You choose the date and amount formats; the app does not guess them, and tells you when another format would fit better.
  2. Maps columns, with common English and Italian headers (Cliente, Imponibile, IVA, Totale, Scadenza, Data pagamento) pre-selected. You can change every mapping.
  3. Checks the data before any chart. Rows with errors (empty required cells, impossible dates, non-numeric amounts, future dates, exact copies, the same ID on different rows) are left out of every number and listed with file, line, column and value. Warnings (net + VAT not equal to gross, negative amounts, due or paid date before the invoice date) keep the row and flag it.
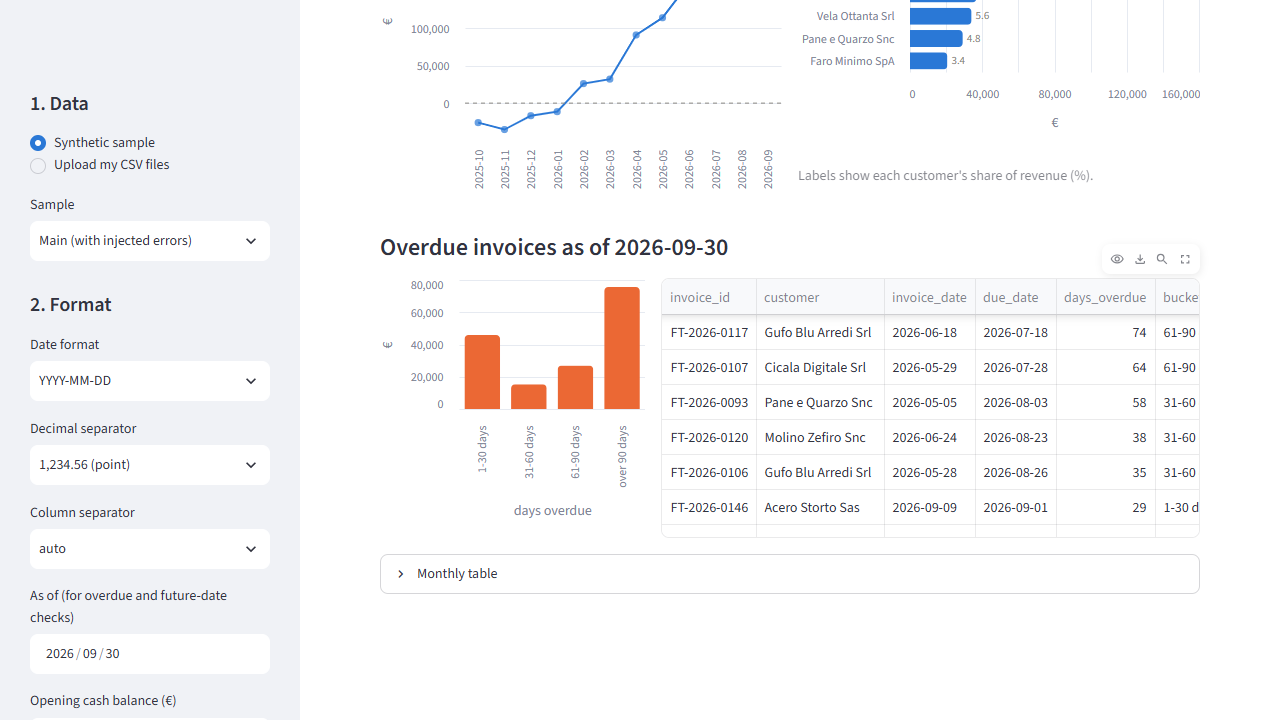
  4. Computes the KPIs from the rows that passed, with a banner saying how many rows were left out: revenue, expenses, profit and margin, cash balance, top customers, and overdue invoices by age (1-30, 31-60, 61-90 and over 90 days). Money is handled in whole cents, so totals are exact.

Local processing runs on your own computer, with owner access.

Data checks tab listing problems in synthetic sales and expense files, each with line number, column and value.
Data checks and KPI charts · synthetic data, 5 October 2026.
KPI tab with revenue, margin, cash trend and overdue invoices computed from synthetic data.
Overdue invoices · synthetic data, 5 October 2026.

Results

Twelve months (October 2025 to September 2026) of invented invoices and expenses, with faults planted on known lines. Measured 5 October 2026; figures from the project's evaluation summary.

SetFormatSales rowsExpense rowsPlanted faults foundFalse alarmsKPIs equal the reference
mainISO dates, 1234.56, comma15815057 of 570yes
holdoutISO dates, 1234.56, comma15615757 of 570yes
italian_formatDD/MM/YYYY, 1234,56, semicolon16615557 of 570yes
cleanISO, no faults1501570 of 00yes
Total171 of 17104 of 4 sets
  • Planted faults found: each fault must be flagged by the right check on the right line.
  • KPIs equal the reference: revenue, expenses, cash, overdue amounts, monthly series and the top-10 customers computed by the app from the faulty files equal, to the cent, figures computed separately from the generator's answer key.
  • What this does not show: the faults are the ones we chose to plant, and the generator and the checks were written by the same developer. A perfect score shows the checks do what they claim; it does not show they catch every problem in real exports.

Technical background

Python, pandas, Altair (charts), Streamlit; tests with pytest and Playwright; packaged with Docker.

Limits

  • Synthetic data only; not tested on real exports from any accounting program or bank.
  • Expenses are treated as paid on their date; there is no accounts-payable view.
  • Partial payments are not supported: an invoice is either paid or not.
  • Credit notes are kept and flagged, not matched to their invoice.
  • One currency (EUR). Excel files are not read; export to CSV first.
  • A reporting aid, not accounting or tax advice.

Source: snello-kpi-dashboard README and reports/summary.json, generated 5 October 2026. Code is private, so it is not linked.

Related work

Synthetic data

doc2data

Invoice and receipt PDFs and scans to checked, structured data.

Test results and limits

0 field errors on 3 clean synthetic sets of 16 documents; 92.9% (131 of 141) and 91.4% (127 of 139) of fields on degraded synthetic scans (measured 2 October 2026).

Read the project: doc2data

Bring your workflow into focus.

Send up to 3 samples or describe one process. We reply by email with what is feasible and how we would measure it.

Start a project

Optional AI assistance

The project now includes optional Groq assistance, disabled by default. The original local checks, calculations and source passages remain the basis for results. AI output needs human review.

After administrator setup, explicit consent is required before text is sent to Groq. Explanation tools show a context preview; invoice extraction can send OCR or document text after its consent step. API credentials stay on the server. Owner access, upload limits and a shared request budget protect the local demos.

This static website does not run the assistant or accept document uploads. Earlier demo recordings and measurements cover the original local workflows; the Groq integration has not yet been evaluated with live requests.

SNELLO / TOOLS

This explains the tool; it is not a live AI session. No document is uploaded.

Our working method
Full diagram

Read the project

Discuss your project

Send up to 3 samples or describe one process, the tools you use and the result you need.

snello.contact@gmail.com

Go to the Contact page

Navigation